
May 02, 2018
Sheryl Sage
Sysdig
4 min read
In March 2018, Mesosphere DC/OS introduced production Kubernetes-as-a-Service on DC/OS, allowing operations teams to deploy, scale and upgrade Kubernetes. We at Sysdig want to congratulate the Mesosphere team today on certifying DC/OS 1.11 with the latest Kubernetes 1.9 release by the Cloud Native Computing Foundation. In this blog post, I'll share how Sysdig helps you understand how your containerized applications and microservices are doing – with service-level monitoring and security to help you troubleshoot connections, errors, response time, slow database queries, top URLs or custom Prometheus, statd or JMX metrics.
Containers are great for application portability, pushing code faster across multiple environments enabling the delivery of reliable products faster. Unfortunately, containers are black boxes, making it difficult to hunt down threats, bottlenecks and policy violations.
The ephemeral nature of containers and growing scale make it difficult to track the health of the services from individual containers. Legacy monitoring and security tools were not built for containers and cannot effectively see, analyze or protect containers and microservices. Monitoring at the service level — rather than individual containers — is a better way to understand how they interact with each other, which is vital when using microservices that spans multiple containers and services. Fortunately, the Sysdig Container Intelligence Platform was purpose-built to monitor and secure containers managed by the DC/OS platform and makes it insanely easy to drill in to performance and activity going on inside your containers and microservices. Let's take a look at 3 challenges of managing containers and microservices in large-scale deployments, and show how you can monitor and secure them with DC/OS and Sysdig.
Challenge 1: Aggregate and view performance metrics by application, container image, host or network.
You chose DC/OS for seamless installation and ongoing automated management of the Kubernetes clusters. Sysdig's unique approach also makes it easy to collect metrics by using a single monitoring agent per node to provide both security and monitoring. Sysdig ServiceVision provides data enrichment with service-oriented metadata from DC/OS or Kubernetes that increases the value of your information. A service-oriented view allows you to aggregate metrics, or drill into your data to troubleshoot a specific issue by application, container image, host or network. You can quickly visualize the health of all infrastructure components – grouped or individually – in graph, table, and map formats, from a variety of host and cloud services ‘views'.
You're able to explore your containers based on their physical hierarchy (for example, Host > Pod > Container) or based on their logical microservice hierarchy (for example, Namespace > Deployment > Pod > Container).
Challenge 2: Securing Kubernetes services.
The goodness of containers – black box application isolation – makes it hard to see what is going on inside. How can you detect anomalies and block attacks?
The same metadata used for performance monitoring, can be used to apply security policies and protect your Kubernetes services – if you are collecting the right security and compliance events. Fortunately, Sysdig does that alongside monitoring.
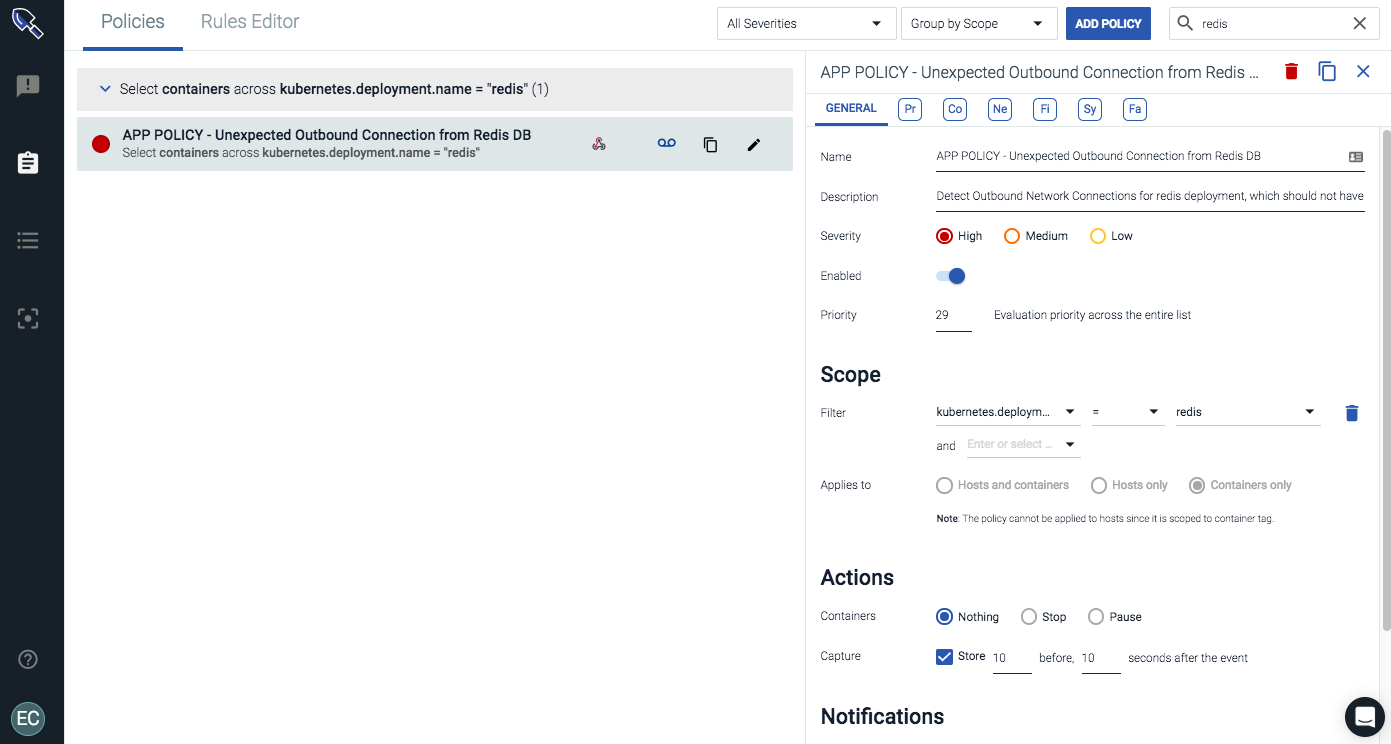
Using a label like kubernetes.deployment.name, we can enforce a policy to protect a logical service regardless of how many containers, hosts or regions the deployment is running in. Other approaches only enforce a policy by image name… leading to all sorts of complications in any environment larger than a test cluster.
The image below is a policy to protect my Redis Kubernetes deployment from an exfiltration event by detecting an unexpected outbound connection from that logical service. From there, we can also take actions on any policy violation to quarantine the container before any data has left our Redis service.
Challenge 3: Forensics in container environments
Effective container runtime security hinges on a team being able to quickly detect and respond to security threats on live containers– from detection, to remediation, to forensics. Troubleshooting incidents in a container environment is challenging: containers are ephemeral and the data we want is often long gone. It is also difficult to tell what is running inside of a container. As a result, for forensics and incident response, troubleshooting and analysis tools are often not installed. If you need to look at historical data – say from a week ago during an unexpected runtime compliance violation – you likely won't have any meaningful data in your health dashboards in DC/OS or Kubernetes.
Fortunately, Sysdig's unique instrumentation allows you to capture all activities from users, processes, and even contents written to file or passed over to the network, pre and post policy violation, and then store it indefinitely. You can detect abnormal container and application behavior from the baseline, leveraging host, process, network and file system activity – and remediate potential threats, via container isolation, pausing or killing a suspicious container.
For more details on container troubleshooting and forensics, read Sysdig Inspect: A GUI for system call analysis.
Conclusion
The Sysdig Container Intelligence platform provides the perfect Kubernetes-as-a-Service DC/OS companion to monitor and secure your infrastructure and applications. Sysdig goes one step further and thanks to its troubleshooting, post-mortem analysis and forensic capabilities can close the loop and give back to your DevOps team, developers and security analyst the required information of what happened, where, why and who was involved. You can learn more by accessing Sysdig's resource center or signing up for a 14-day Sysdig trial.