Prometheus metrics become the basis for automation and self-healing in a modern data engineering platform like Mesosphere DC/OS.

May 17, 2018
Elizabeth K. Joseph
D2iQ

5 min read
First, I have to set some context. I love metrics and monitoring. I've run Nagios (and now run Icinga2) for years to track machines and devices on my LAN and servers in data centers around the world. So it should come as no surprise that when I started exploring the world of containers, Prometheus stood out to me.
Prometheus is an open-source monitoring system that uses a time series database to store metrics. In a typical configuration, hosts you're monitoring have some sort of exporter that serves up information to Prometheus, where everything is collected and the processing is done.
DC/OS 1.11 can send metrics to Prometheus without the need for a metrics plugin like earlier versions.
Prometheus on Fire at Kubecon!
Given my interest, I was thrilled to see over 15 talks at KubeCon + CloudNativeCon in Copenhagen, including a keynote on Wednesday evening. The keynote was delivered by Fabian Reinartz, a Staff Software Engineer at CoreOS, and the focus of his talk was the new 2.0 release. Loosely based on
a blog post written upon the release back in November, what struck me the most about it were the massive scaling improvements. If you ask anyone who has worked on large installations, scaling reliably and well is the Holy Grail of monitoring systems and with this release they're boasting reductions across the board in CPU utilization, disk space usage, and disk I/O over the 1.8 release:
The keynote is only 15 minutes long and well worth the watch to see the improvement graphs he presented, along with a review of some of the other improvements made in this release.
Prometheus is definitely a great project when it comes to monitoring, and there were talks at the conference that covered advanced related topics, like
Declarative Multi-Cluster Monitoring with Prometheus by Matthias Loibl, Loodse & Frederic Branczyk of CoreOS and Federated Prometheus Monitoring At Scale Nandhakumar Venkatachalam & LungChih Tung from Oath Inc. Monitoring is familiar to me though, so my focus was on talks that do interesting things with the metrics.
In a talk by Frederic Branczyk on how to
Autoscale your Kubernetes Workload with Prometheus he covered the new resource and custom metrics APIs in Kubernetes that can work with Prometheus to facilitate auto-scaling when workloads require it. To this end, he referenced the k8s-prometheus-adapter as an example of a project using the APIs to horizontally scale.
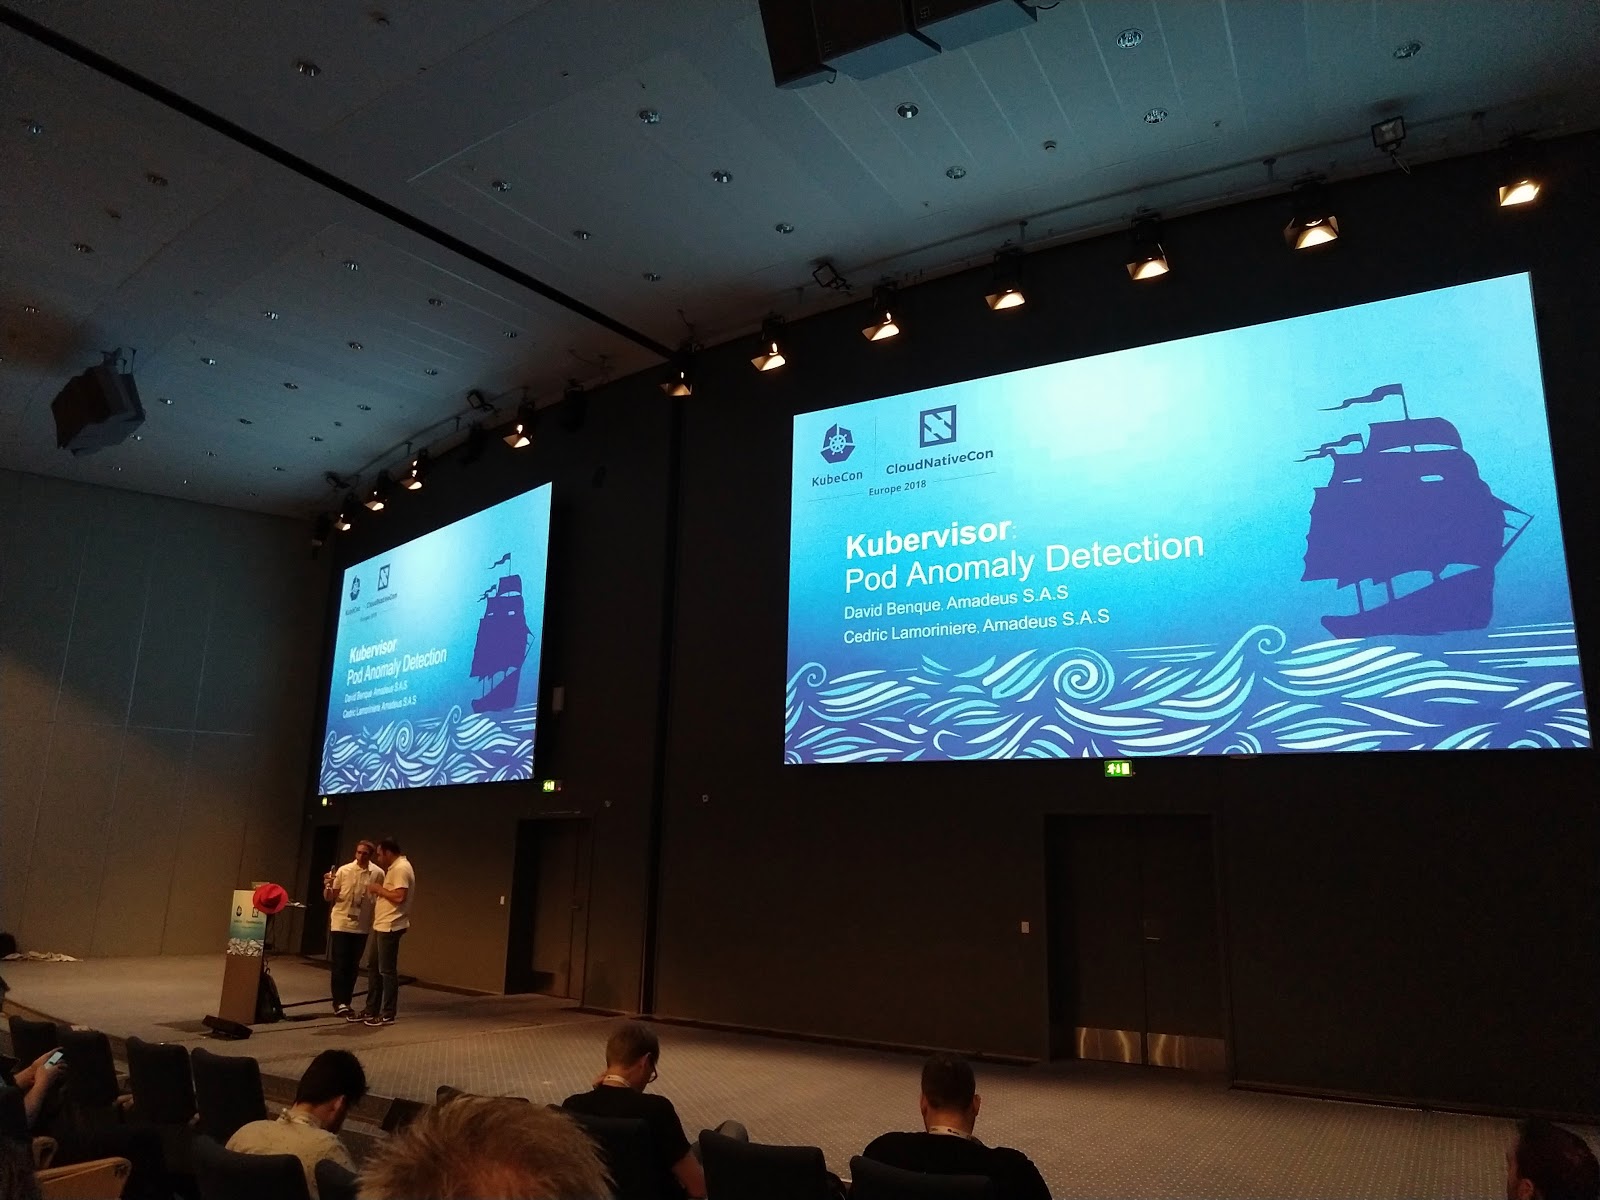
The next talk on Prometheus I saw was on
Pod Anomaly Detection and Eviction using Prometheus Metrics by David Benque & Cedric Lamoriniere at Amadeus. Again, taking some of the metrics that you wouldn't necessarily have someone in operations view regularly or act upon, it teaches the cluster to be self-healing by detecting anomalous behavior from pods and evicting them after traffic has been re-routed. They built the open source Kubervisor to serve this purpose, which can use Prometheus as the external data source for what may be classified as an anomaly. Additionally, I really enjoyed how upfront they were about the complexity of these systems. They operate from the assumption that there will be failures, especially cascading dependency failures that cause major problems, so automating as much recovery as you can is tremendously valuable.
Prometheus 2.0 is more performant and scales better that previous releases. By leveraging the latest Kubernetes APIs it also has you covered with the metrics that can help you automate some of the more advanced techniques for cluster management. As for me, maybe it's time for me to once again evaluate my monitoring infrastructure.