It's incredibly straightforward to deploy production-ready data services into your DC/OS cluster in a few clicks, but why stop there? Let's take the next step and connect data services to create a complete data pipeline!
For this guide, I will show an example of utilizing the Confluent Platform leveraging the following tools in order to pipe data to an ElasticSearch service co-located in my DC/OS cluster:
- Confluent-Kafka
- Confluent-Connect
- Confluent-Control-Center
- Confluent-REST-Proxy
- Confluent-Schema-Registry
- Elastic
If you are interested in learning more about Confluent, take a look at this
blog post by Kai Waehner covering why Confluent Platform, DC/OS, and microservices work hand-in-hand to produce highly scalable microservices.
Note that this guide leverages some of our Certified frameworks in the DC/OS Service Catalog (Confluent-Kafka, Elastic). Certified packages (as discussed in
part 1 of this tutorial blog series) are Enterprise-supported and production-ready frameworks built in conjunction with our partner network adhering to best practices for deployment, Day 2 Operations, and maintenance. As a quick recap, DC/OS Certified packages typically support:
- Single-line install command
- Built-in health monitoring
- DC/OS CLI subcommands
- Rolling updates
- Rolling configuration updates
- Configurable placement constraints
- Production grade security
- Multitenancy
- Enterprise support through a channel partner
The architecture of the solution we're building today (visualized below) is commonly used in many fast-data (streaming) solutions today. By using a highly scalable and highly available publish-subscribe solution such as Apache Kafka, customers can build powerful distributed applications at web-scale. This way, multiple raw data sources can pipe data into Kafka and tools such as Apache Spark can be used for analysis on Kafka streams and persisted into many different data services.
Benefits of running Kafka on DC/OS
While DC/OS streamlines the implementation of data services, it also makes Day 2 Operations such as scaling, management, networking, and monitoring insanely easy. Here are some examples:
- Automated provisioning and zero-downtime upgrades of Kafka components. All Certified DC/OS frameworks are built with best practices in mind and are quick and easy to deploy. In Day 2 Operations however, Mesosphere brings value by making it simple to upgrade, scale, and manage the cluster past the deployment phase from a single graphical management console and control plane.
- Unified management and monitoring of multiple Kafka clusters on a single infrastructure. Many companies have multiple Kafka clusters per each business unit, each managed by a separate team. By running Kafka on DC/OS, you can manage multiple team clusters from one single pane of glass, driving up operational efficiency and lowering management costs.
- Elastic scaling, fault tolerance, and self-healing of Kafka components. Kafka on DC/OS is built out-of-the-box to be a highly scalable and fault tolerant solution. Our team has worked together with Confluent to create an enterprise grade and production-ready solution that can be easily deployed and managed.
Apache Kafka on DC/OS Guide
For this guide, we will walk through deployment using the GUI as much as possible so that you can get a visual representation of the end solution. However, we recommend that you script and automate this in production settings with the CLI and API tools provided by Mesosphere.
Prerequisites:
This guide uses 21 CPU shares in DC/OS. I typically test on a DC/OS cluster using m4.xlarge instances with 8 private agents and 1 public agent.
Step 1: Deploy Services
Once your cluster is
up and running, navigate to the DC/OS Catalog and search for the Confluent packages. Deploy the default packages listed below by clicking package —> review & run —> run service.
- confluent-kafka*
- confluent-connect
- confluent-control-center*
- confluent-rest-proxy
- confluent-schema-registry
- elastic
- Marathon-LB
*Note: A Confluent license is required to use this package. The trial lasts for 30 days.
Note: It may also be useful to install the CLIs associated with these services:
- dcos package install elastic —cli —yes
- dcos package install confluent-kafka —cli —yes
-
Step 2: Expose Confluent Control Center and Confluent REST Proxy using Marathon-LB
Select and edit the configurations for control-center and navigate to the Environment tab in the left column. Add a label (Key: HAPROXY_GROUP / Value: external) to expose the service and select Review & Run —> Run Service.
Repeat step 2 for the REST-proxy service as well.
Step 3: Access Confluent Control Center
Now that Confluent Control Center is properly exposed to the public internet, we can access the server via the port (10002) that was assigned by Marathon by opening http://<public_node_IP>:10002 in a browser. In the recent DC/OS 1.11 release we have added the capability to view service endpoints through the GUI. Simply navigate to the Control Center service --> endpoints tab to view the Service Port.
In this case we can access Control Center by opening http://<public_node_IP>:10002 in a browser.
You should see this:
Step 4: Create a Kafka Topic
Create a Kafka topic using the Confluent-Kafka CLI command below:
dcos confluent-kafka topic create <topic_name>
Output should look similar to this:
Step 5: Configure Elastic Connector in Confluent Control Center
First, grab the Elastic coordinator-http service endpoint by running the command below:
dcos elastic endpoints broker coordinator-http
Output should look similar to this:
Go ahead and grab the Confluent-Kafka broker endpoint as well, since we may need it later:
dcos confluent-kafka endpoints broker
Navigate to the Kafka Connect tab in Control Center —> Sinks —> Add a Sink in order to configure the data pipeline between the Confluent-Kafka and Elastic data services and select topic1 that was just created.
Set your connector class as ElasticsearchSinkConnector and give it a name, in this case I used topic1connector. Continue to fill in the information below:
- Connection URL: http://coordinator.elastic.l4lb.thisdcos.directory:9200
- This value is the VIP in the endpoint example listed above
- Batch Size: 1
- Type Name: kafka-connect
- Ignore Key Mode: true
- Ignore Schema: true
Use an API call to check the Connector Status:
curl -XGET http://<MASTER_IP>/service/connect/connectors/<CONNECTOR_NAME>/status -H 'authorization: token=<DCOS_AUTH_TOKEN>' (see dcos config documentation to get the DC/OS auth token)
The result should be a ‘RUNNING' state:
Note: to retrieve the DCOS auth token you can run: dcos config show core.dcos_acs_token. Keep in mind that it is a good practice to use the dcos config show core.dcos_acs_token as an abstraction as to not expose your token as shown in the example above.
Step 6: Send a post to Kafka using an API call
Using the API syntax below, send a couple of messages to Kafka in AVRO/JSON format. AVRO/JSON format is the easiest to use and preferred format for Kafka:
curl -X POST -H "Content-Type: application/vnd.kafka.avro.v2+json" \
-H "Accept: application/vnd.kafka.v2+json" \
--data '{"value_schema": "{\"type\": \"record\", \"name\": \"User\", \"fields\": [{\"name\": \"name\", \"type\": \"string\"}]}", "records": [{"value": {"name": "Alex"}}]}' \
http://<PUBLIC_NODE_IP>:10003/topics/<TOPIC_NAME>
Output should look similar to below:
Step 7: View Data Persisting in Elastic
In order to view data persisting in Elastic we can leverage the popular
byrnedo/alpine-curl docker image. Create a Service either through the GUI and input the following as the command (see picture below for more detail), or use the Marathon app definition to deploy using the DC/OS CLI:
curl -XGET coordinator.elastic.l4lb.thisdcos.directory:9200/<TOPIC_NAME>/_search?pretty &&sleep 200
For your convenience, you can also use this Marathon app definition curl.json below via the DC/OS CLI:
dcos marathon app add curl.json
{
"id": "/curl",
"backoffFactor": 1.15,
"backoffSeconds": 1,
"cmd": "curl -XGET coordinator.elastic.l4lb.thisdcos.directory:9200/topic1/_search?pretty && sleep 300",
"container": {
"type": "DOCKER",
"volumes": [],
"docker": {
"image": "byrnedo/alpine-curl",
"forcePullImage": false,
"privileged": false,
"parameters": []
}
},
"cpus": 0.1,
"disk": 0,
"instances": 1,
"maxLaunchDelaySeconds": 3600,
"mem": 128,
"gpus": 0,
"networks": [
{
"mode": "host"
}
],
"portDefinitions": [],
"requirePorts": false,
"upgradeStrategy": {
"maximumOverCapacity": 1,
"minimumHealthCapacity": 1
},
"killSelection": "YOUNGEST_FIRST",
"unreachableStrategy": {
"inactiveAfterSeconds": 0,
"expungeAfterSeconds": 0
},
"healthChecks": [],
"fetch": [],
"constraints": []
}
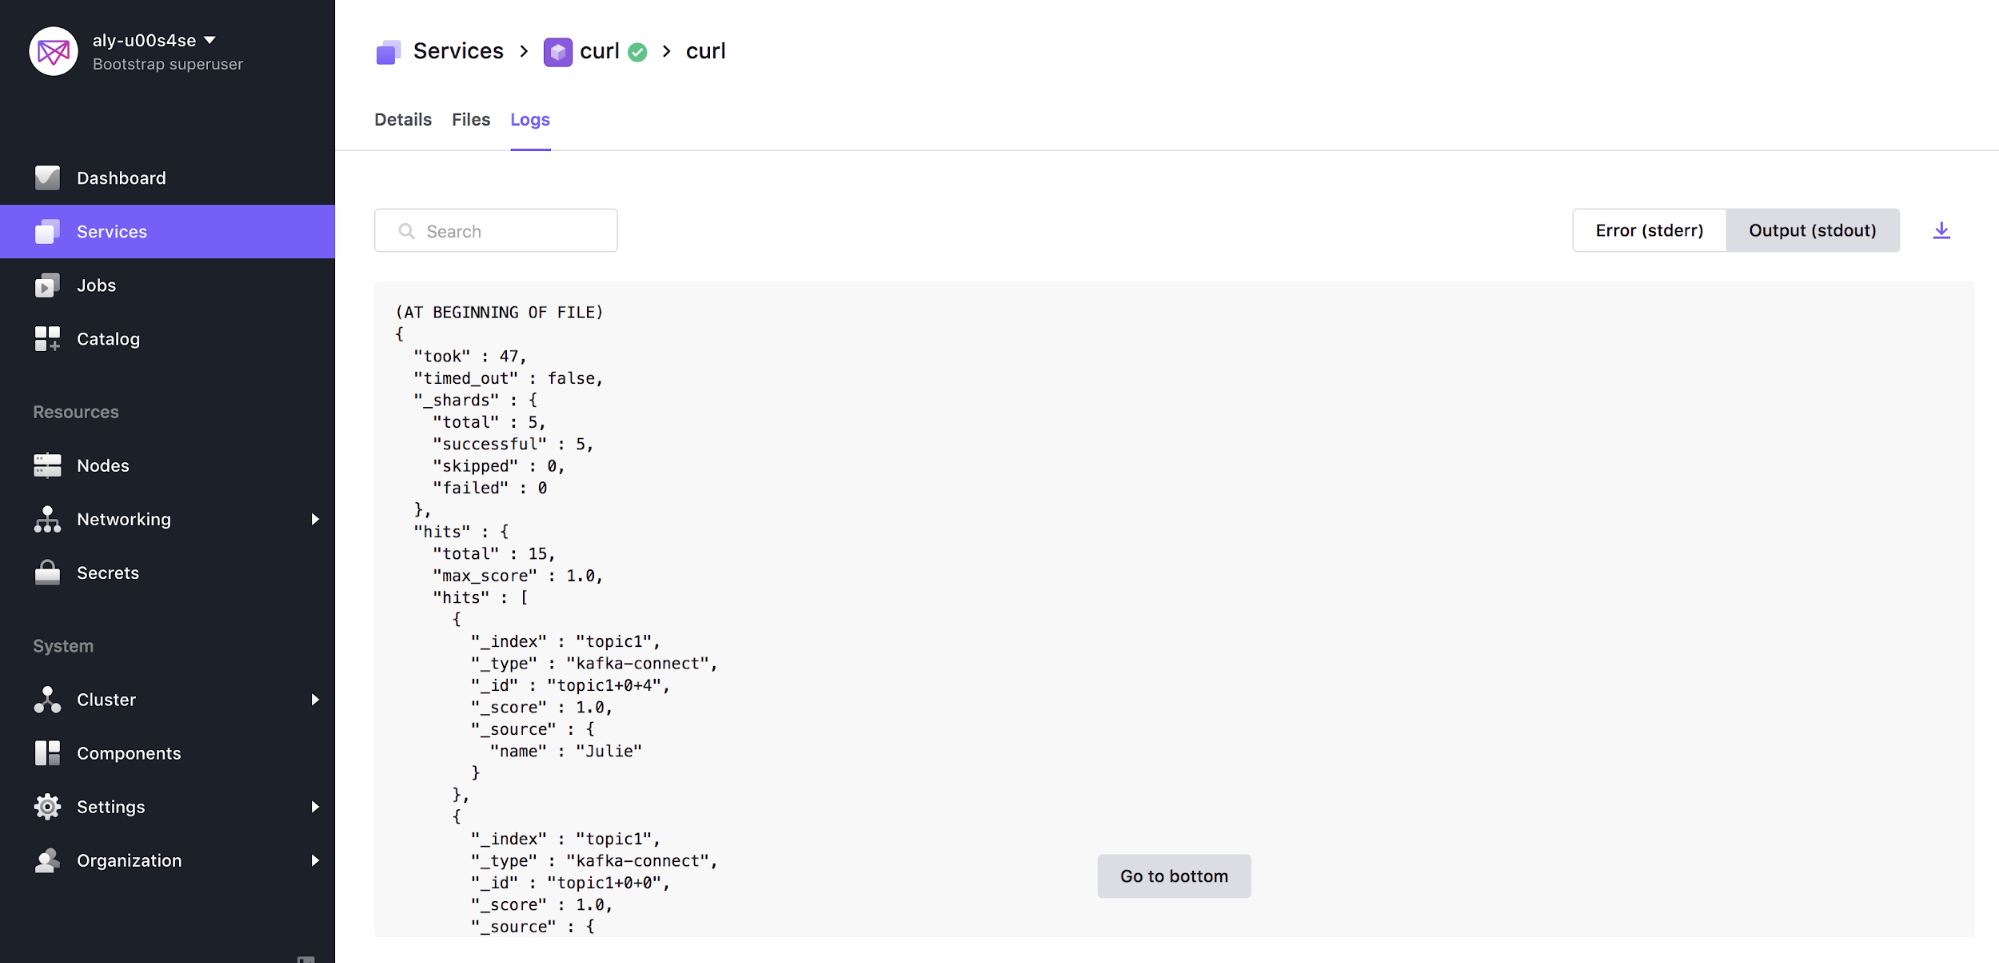
Congrats! If successful, you can navigate to the STDOUT of the curl service that was just created and see that data has been persisted in Elastic. The output should look similar to below:
Summary
Data pipelines often consist of multiple complex components such as Kafka, Spark, Elastic, and Cassandra. DC/OS provides a platform that simplifies the deployment and management of such solutions using our operational expertise to automate non-trivial tasks. In this article, I showed you how to build a data pipeline to work with streaming data from multiple sources. In a future blog, I will elaborate to show how we can use analytics tools such as Spark in order to complete the data lifecycle from start to finish.

