


Jan 17, 2017
Gaston Kleiman
D2iQ

7 min read
In part one of this series, we introduced you to the brave new world of Mesos-native health checks.
In part two, join us as we take a deeper dive to reach the scaling limits of Marathon and Mesos-native health checks.
Setup
We ran scale tests against single-master DC/OS clusters running on m3.xlarge (4 vCPUs and 15 GiB RAM) instances on Amazon EC2. Our goal was to find out how a cluster with health checked tasks behaves under load.
Mesos health checks will be supported in DC/OS 1.9, so we created a custom DC/OS build with Marathon v1.4.0-RC1 and a version of Mesos with support for HTTP and TCP health checks.
How we tested
We wanted to see how both Mesos and Marathon behave as we scale up the number of tasks being probed.
The test tasks run nc to test TCP health checks, and python -m SimpleHTTPServer to test HTTP health checks. We used the following configuration for all health checks (full Marathon Application Definitions):
gracePeriodSeconds: 20intervalSeconds: 1maxConsecutiveFailures: 3delaySeconds: 0
We then wrote a Python script that tries to scale the application up, while plotting a chart to keep track of the state of all the tasks.
The script polls Marathon every two seconds to fetch the state of the app. If it is already being scaled up, it will group the tasks by their state and add them to a stacked bar chart.
If the target instance count has already been reached, it will automatically request Marathon to scale the app up by n instances.
The generated charts look like this:
The X axis represents the request number, the Y axis the number of tasks - so each complete bar represents all the tasks contained in a Marathon API response, and each segment in the bar represents the percentage of tasks in a particular state. The title mentions the type of health check, the number of agents in the cluster, and the timeout: the amount of time to wait for the health check to complete.
We defined the following task states:
STAGING
Marathon tried to launch the task, but Mesos hasn't sent a task update reporting it as running.
RUNNING
The task is running (in the TASK_RUNNING Mesos/Marathon state), but Marathon doesn't provide any health check results. Given our app definitions, this state should be transient. task['state'] == TASK_RUNNING && !('healthCheckResults' in task)
HEALTHY
The task is running and healthy. task['state'] == TASK_RUNNING && task['healthCheckResults'][0]['alive']
UNHEALTHY
The task is running, but Marathon says that it is not alive, because it failed the most recent health check. task['state'] == TASK_RUNNING && !task['healthCheckResults'][0]['alive']
KILLING
The maximum number of health check failures was exceeded, so the task is being killed. task['state'] == TASK_KILLING
UNSCHEDULED
Marathon hasn't requested Mesos to launch a task yet.
Results
Baseline
We first set out to find out how many tasks with Mesos/Marathon probes can be started on a single agent. We wanted to be able start as many tasks as possible, so we requested only 0.001 CPU and 64MB of RAM for each one. Each agent has 13.7 GB RAM and 4 CPUs available to Mesos, so memory should be the limiting resource, meaning that we should be able to start up to 219 tasks per agent.
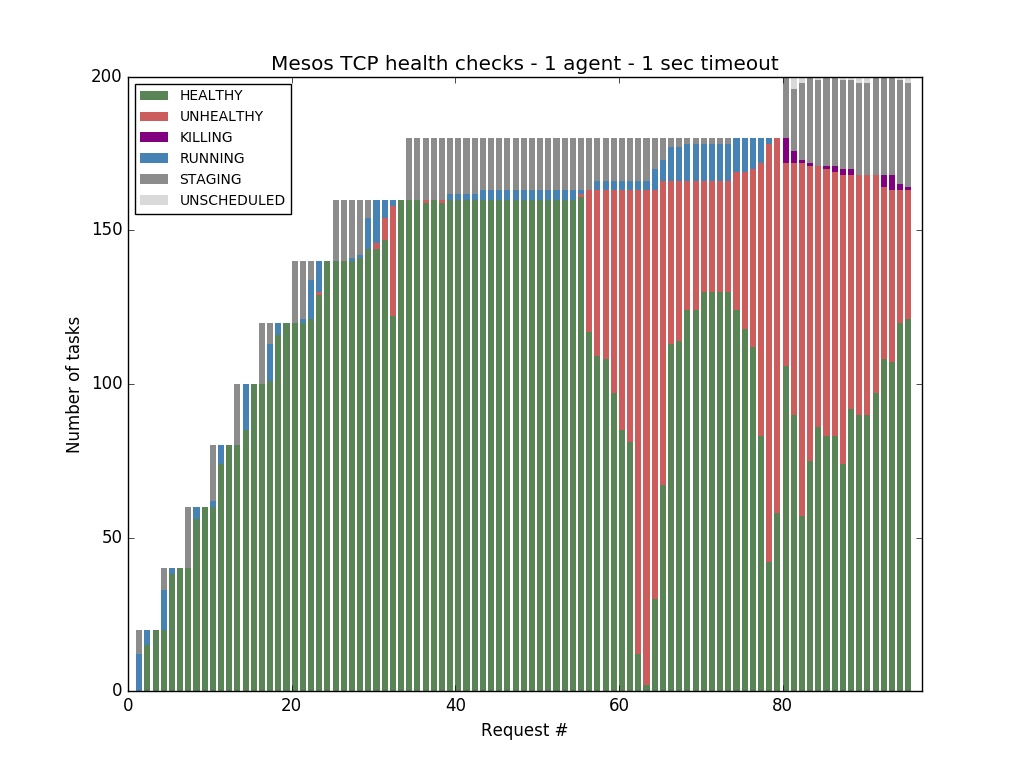
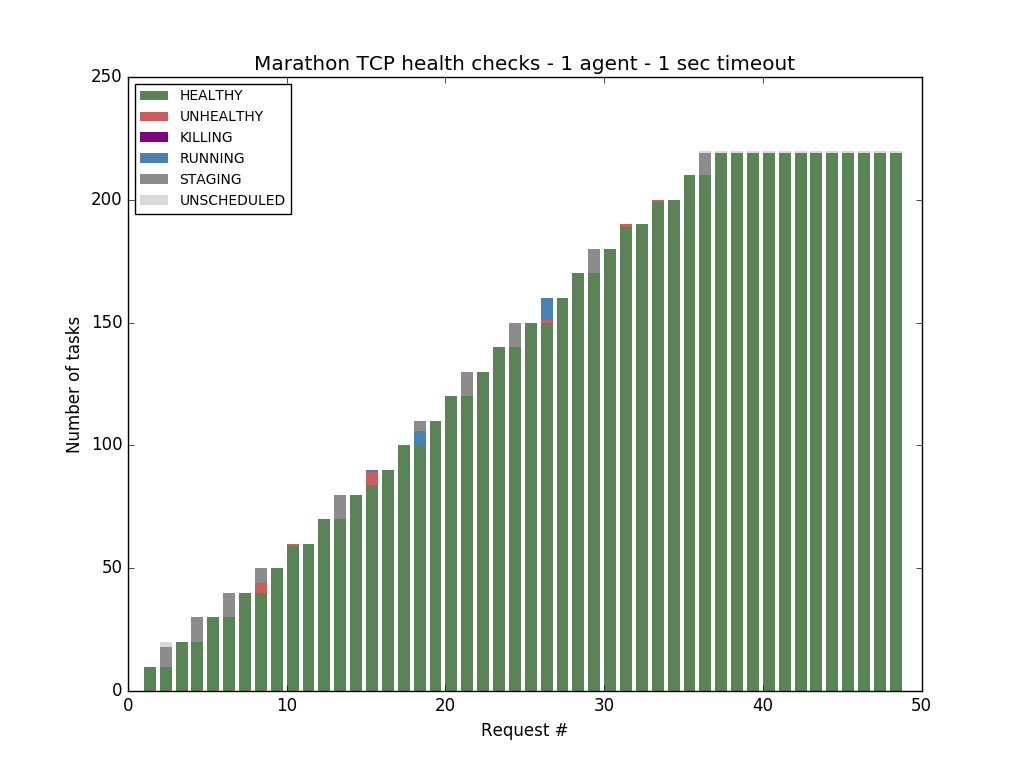
Our initial tests were performed with a health check timeout of 1 second, this means that a health check is considered as failed if it takes longer than 1 seconds to probe the task. Using this setting, it was possible to start all the 219 tasks using Marathon health checks:
But when we switched to Mesos health checks, we noticed that Mesos was not able to cope with more than 121 tasks before starting to report tasks that were healthy as unhealthy:

These failed health checks were caused by timeouts --- it took us some digging (details in the last section) to find out that these health check failures can be attributed to the time spent in context switching.
Hundreds of small (in term of requested CPU resources) tasks with short-lived health checks are not what Mesos-native health checks are optimized for. Also health check timeout should be long enough to prevent false negatives caused by blips related to garbage collection cycles, context switches, I/O spikes, etc.
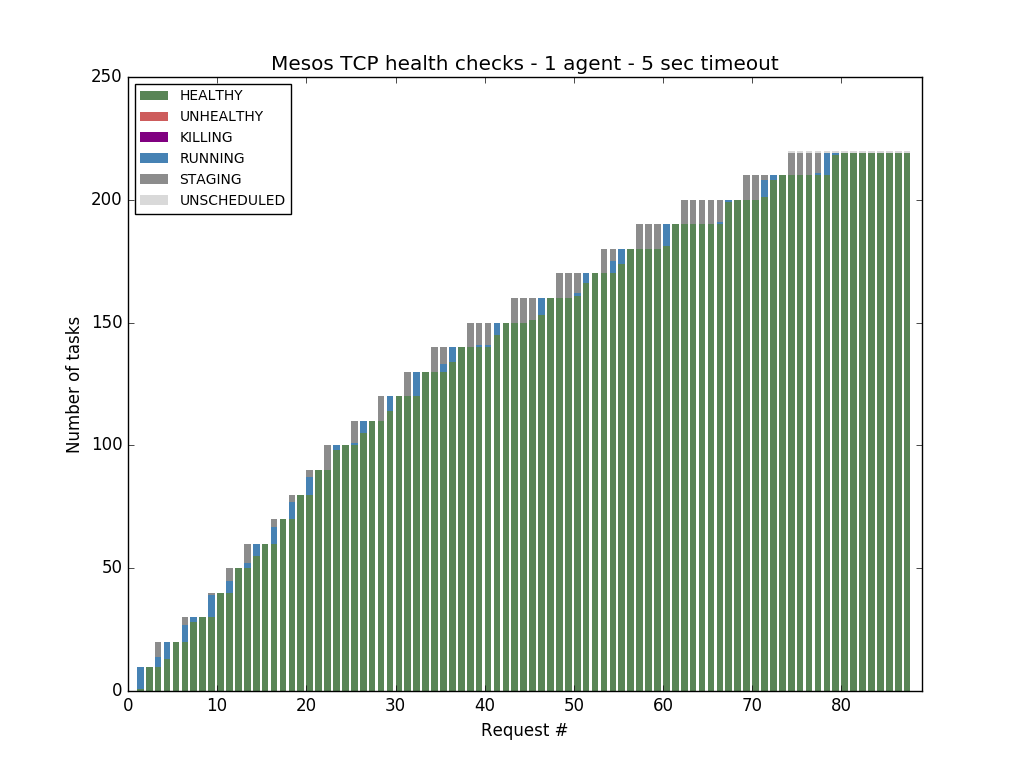
So we decided to use a more realistic value of 5 seconds. Doing this allowed us to saturate a one-agent cluster with 219 tasks regardless of the type of health checks used:
But... does it scale?
Having found a good baseline, we decided that it was time to pay Amazon for a bigger cluster and see how well the different kinds of health checks scale.
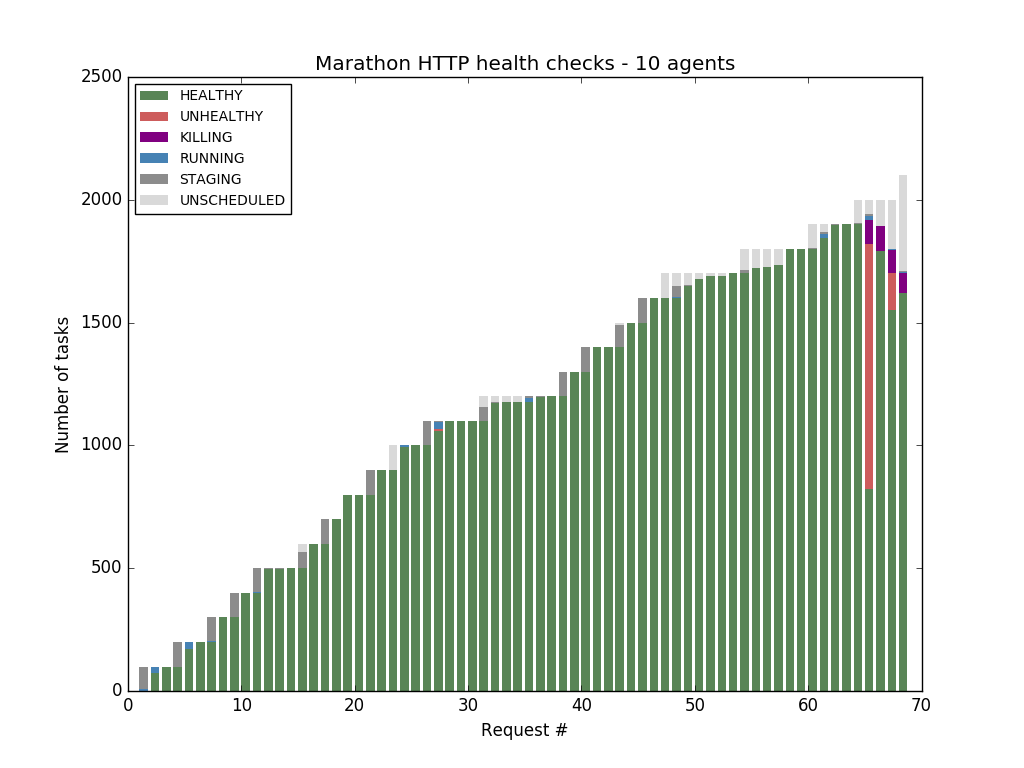
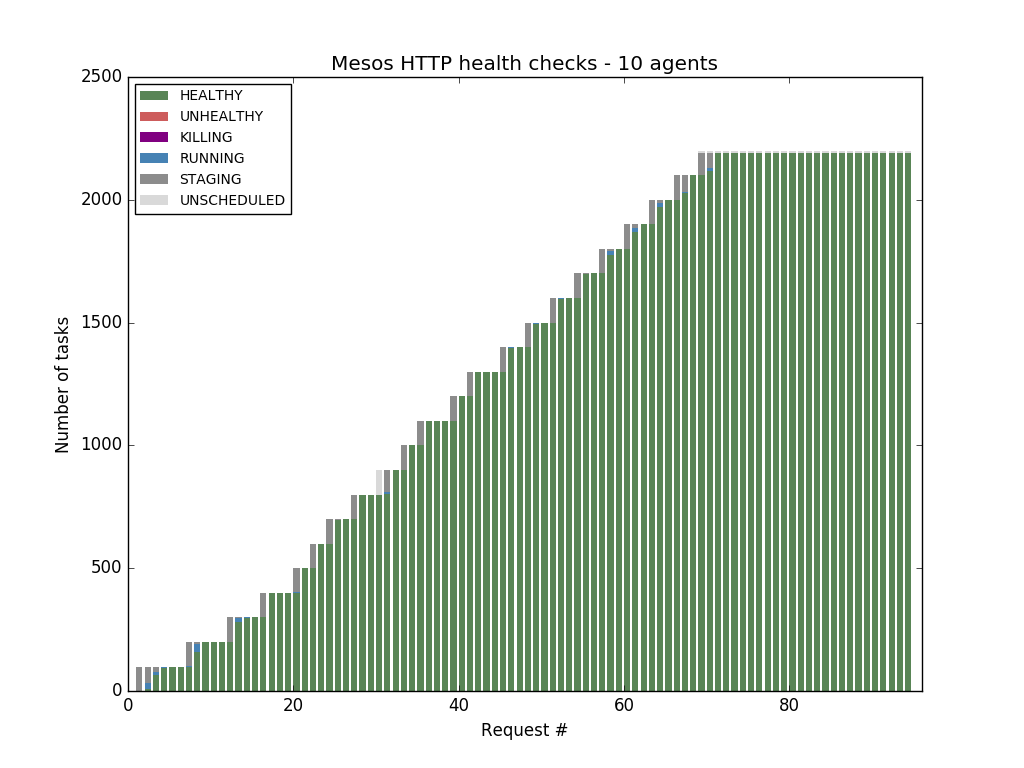
We first ran the tests against a cluster with 10 agents - we were able to saturate the memory of the agents, starting 2190 tasks using Marathon TCP and Mesos HTTP/TCP checks. But when using Marathon HTTP checks, we found out that Marathon started to report health failures and return errors to the API requests when the cluster reached the 1900 tasks mark — the first manifestation of the bottleneck mentioned in part one of this blog post series.
Marathon was still able to cope with all the tasks when using Marathon TCP health checks, so we drank more Fanta, paid more money to Amazon, and added more agents to the cluster, running the tests against 20 agents.
Marathon could handle only up to 3700 tasks with Marathon TCP health checks before excluding the health check results from the API responses and eventually becoming completely unresponsive. This is visible in the next chart - the bars turn blue instead of red, because Marathon stops including the tasks' health status in its API response.
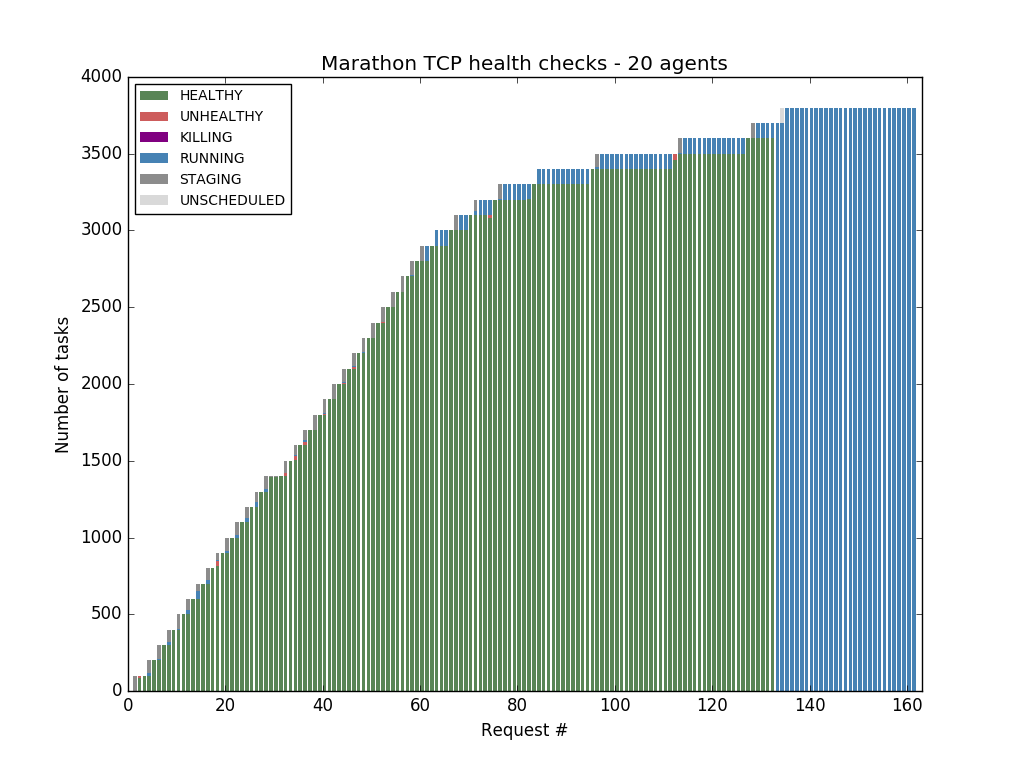
As you can see, even though Marathon TCP health checks are cheaper than Marathon HTTP health checks, Marathon can't manage to probe enough tasks to fill a 20 agent cluster.
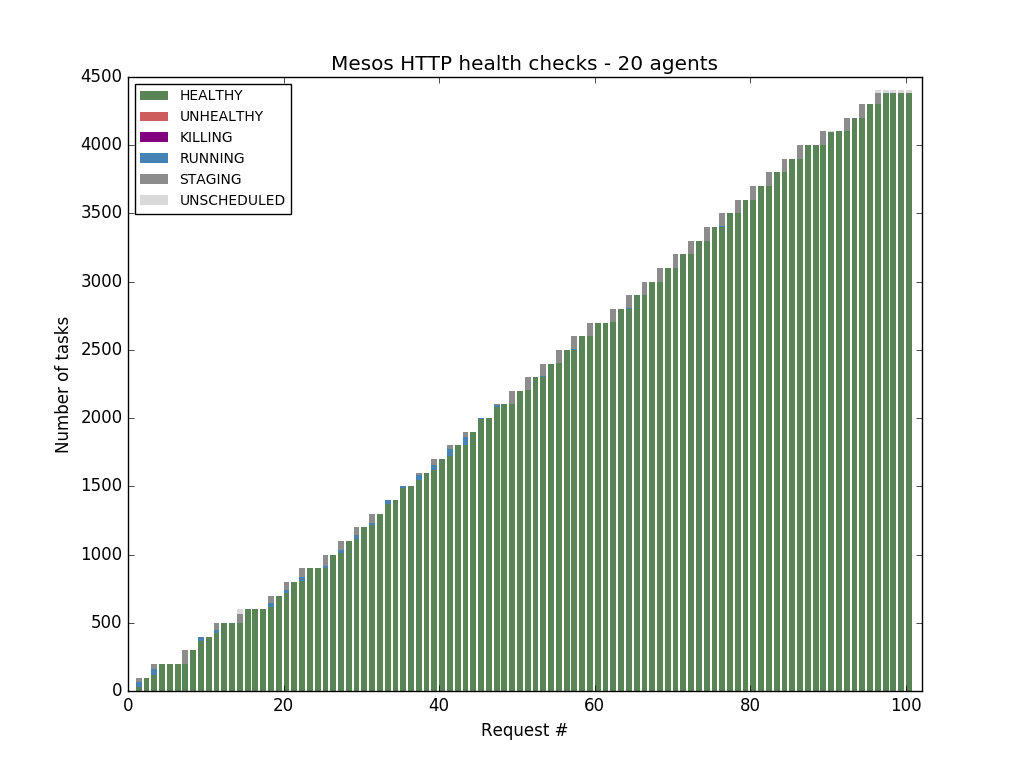
We wanted to confirm that Mesos-native health checks are able to scale horizontally, so we rebuilt the cluster and ran the tests with Mesos TCP and HTTP health checks. In both cases we were able to fill all the agents with 4380 tasks:
Investigating timeout-induced health check failures
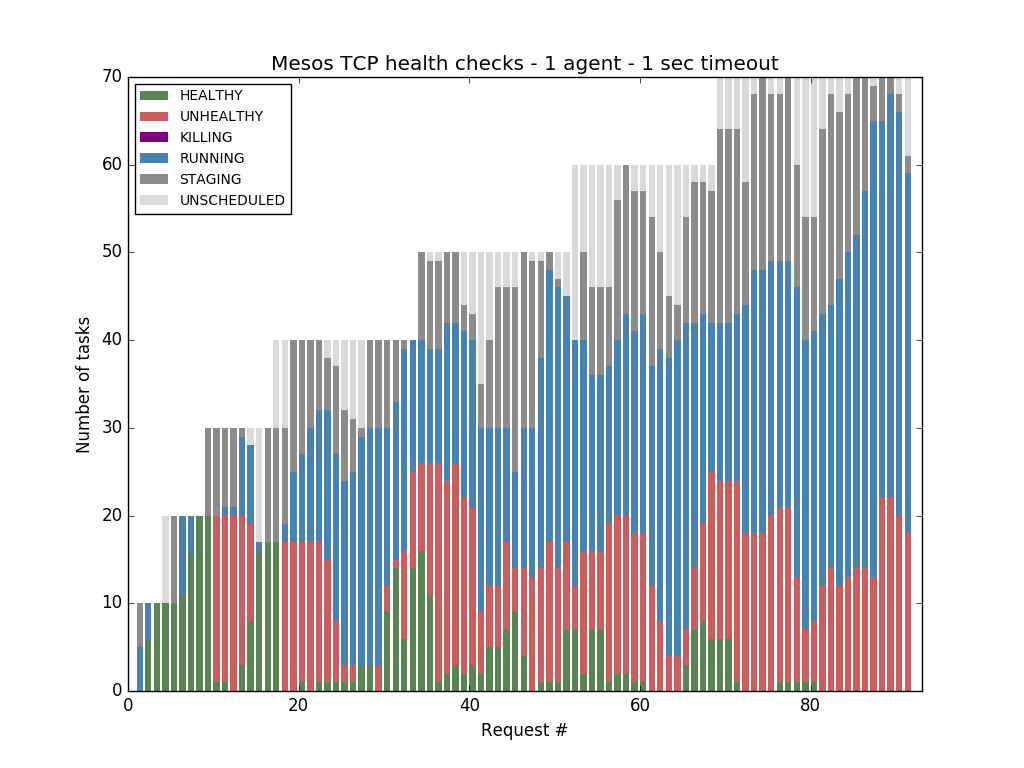
As mentioned above, we observed frequent health check failures on saturated nodes with 1 second health check timeout. We felt upset, hurt and decided to dig in to better understand the reasons.
The Setup
Vagrant-based Virtualbox Ubuntu Trusty machines, 2 CPUs 4GB RAM, used for Mesos: 2CPUs 2929MB RAM. Mesos master and agent launched on different machines 1 2. We run nc tasks with 1s Mesos TCP health checks.
With the task asking for 0.001 CPU and 32MB RAM, the agent is able to host 91 tasks. Executors consume extra resources, but Mesos currently does not account them towards the task's share, which in this case leads to overcommit resources (see MESOS-1718).
Short experiment
We launched 90 instances of that simple nc task using Mesos TCP health checks with 1 second timeout, 10 instances at a time, with sysdig capturing data in the background. Pretty soon health checks began to fail:
Analyzing traces
We generated a trace for a single instance (pid=23457) of the helper binary (mesos-tcp-connect) for TCP health checks. We can see in the compacted version (filtering out mmap and mprotect events), that the process starts at 14:39:53.67 and exits at 14:39:55.87. This is obviously more than 1s. Moreover, the process doesn't try to establish a TCP connection until 14:39:55.86 (event 1628396), over two seconds after having been launched! The TCP handshake did not stand a chance to finish in time.
After several moments of meditation over the trace, it becomes clear that context switches contribute the most to the overall command run time.
Understanding reasons
Why does the TCP checker command receive such a small amount of CPU time? Let's do some back-of-the-envelope calculations.
We have 90 tasks with 3 processes per task:
- The executor (mesos-executor).
- The task payload (nc).
- The health checking process (mesos-tcp-connect).
These processes are spread across 2 CPUs. We assume nothing else other than tasks is eating CPU cycles, which is very optimistic: at least sysdig and mesos-agent processes are busy collecting data and processing task status updates respectively.
Such an optimistic calculation yields: 2 / 270 = 0.0074 mesos-tcp-connect's CPU share.
Sysdig data for this particular instance suggests that the total amount of time mesos-tcp-connect spent in other contexts is 2.17864s 3, while the total run time is 2.32s 4.
That means that the TCP checker did meaningful work only during 1% of the overall run time (0.0174s, or 0.0079 CPU share, looks familiar, right?)!
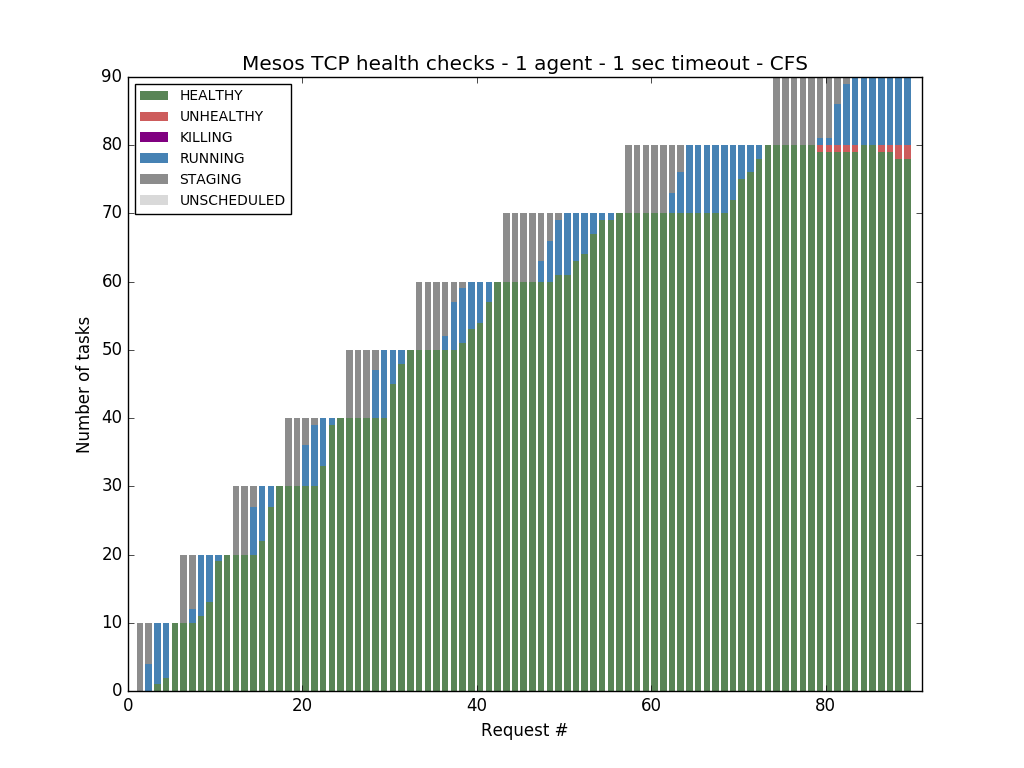
Note that enabling CFS on the Mesos Agent (--cgroups_enable_cfs) improves things a little bit:
LIBPROCESS_ADVERTISE_IP=192.168.2.100 LIBPROCESS_ADVERTISE_PORT=15050 MESOS_WORK_DIR=/tmp/mesos/m1 MESOS_LOG_DIR=/tmp/mesos/log/m1 mesos-master --ip=10.0.2.15 --port=5050 ↩
sudo LIBPROCESS_ADVERTISE_IP=192.168.2.100 LIBPROCESS_ADVERTISE_PORT=25051 MESOS_WORK_DIR=/tmp/mesos/a1 MESOS_LOG_DIR=/tmp/mesos/log/a1 MESOS_CONTAINERIZERS=docker,mesos MESOS_ISOLATION=cgroups/cpu,cgroups/mem,disk/du,filesystem/linux,docker/runtime mesos-agent --ip=10.0.2.15 --port=5051 --master=192.168.2.100:15050 ↩
sysdig -r cap.scap.gz0 proc.pid=23457 | awk '$0 ~ /> switch/ && last~/> switch/ {next} {last=$0} 1' | awk '$0 !~ /> switch/ && last !~ /> switch/ {next} {last=$0} 1' | awk '{split($2,a,":")} {print a3}' | awk 'NR%2 {p=$1; next} {print ($1-p)}' | awk '{sum+=$1} END {print sum}' ↩
sysdig -r cap.scap.gz0 -c proc_exec_time proc.pid=23457 ↩