
Jun 28, 2019
Ernest de León
D2iQ
2 min read
Today we are proud to announce the general availability of Mesosphere DC/OS Monitoring. DC/OS Monitoring enables you to easily collect, store, report, and visualize metrics delivering greater operational insight for your applications and cloud-native services.
What is DC/OS Monitoring?
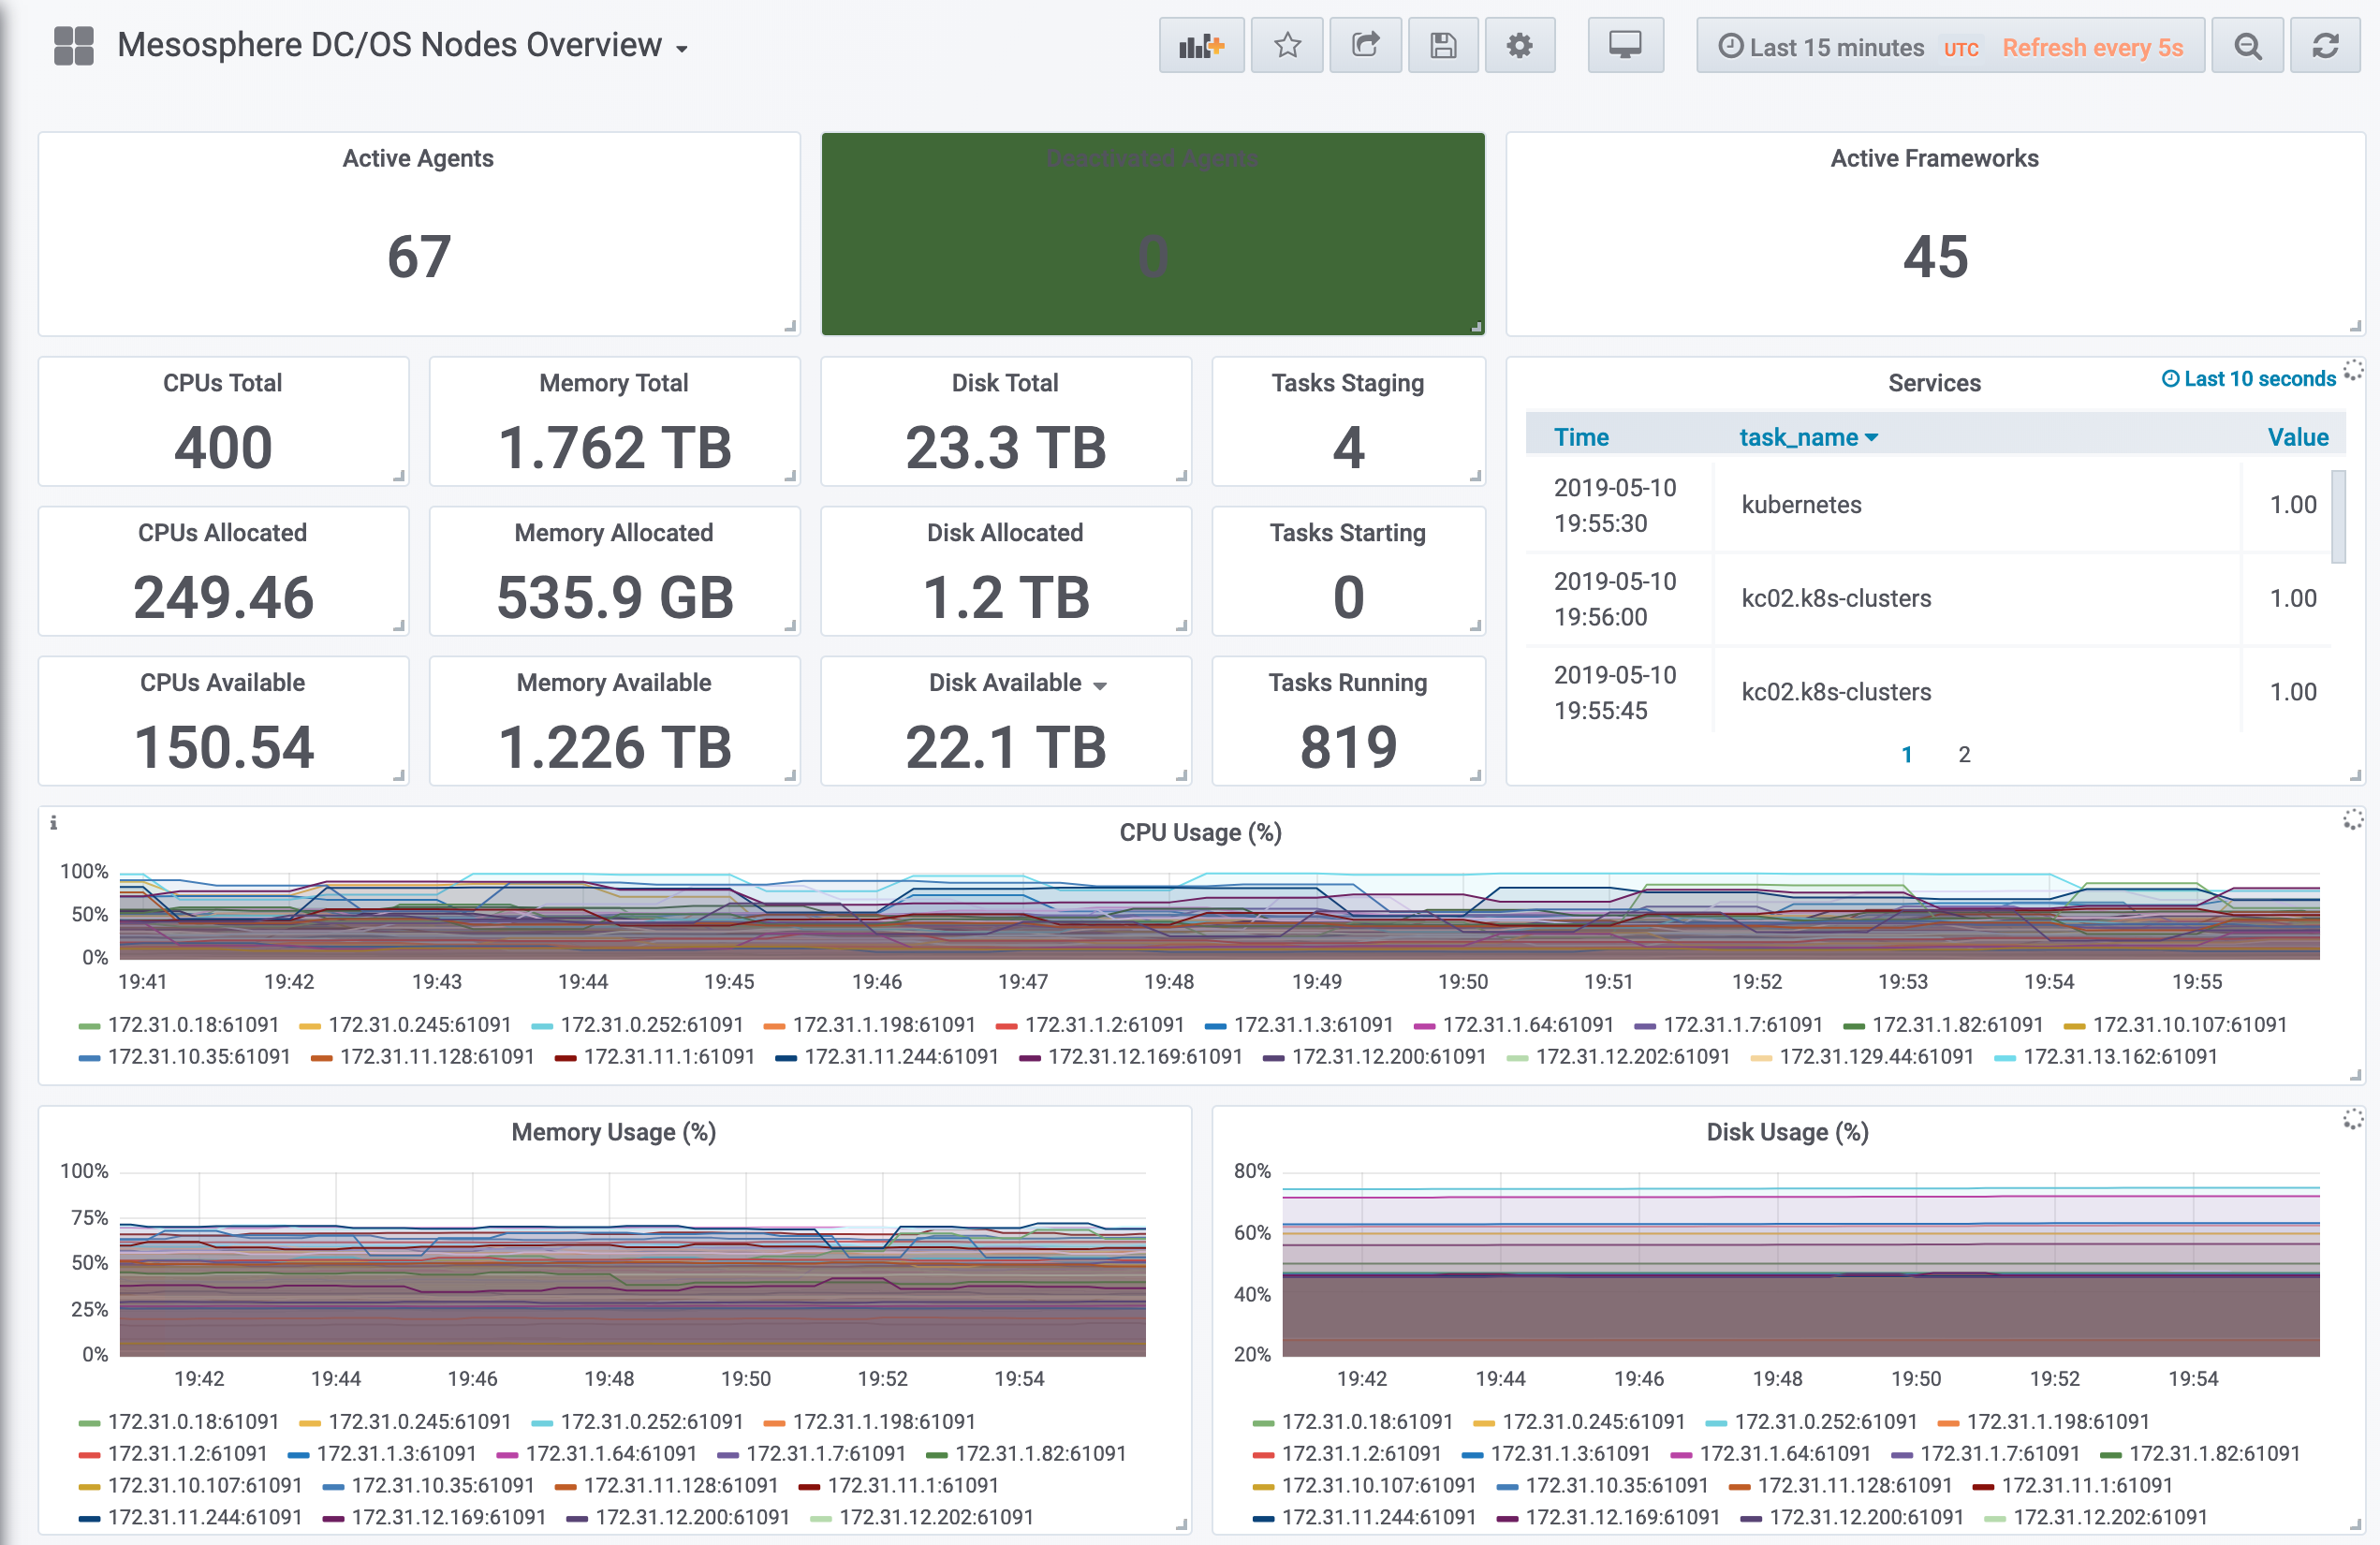
DC/OS Monitoring is a framework for collecting and displaying metrics relevant to the operation of a Mesosphere DC/OS cluster. It is an integrated and pre-configured metrics pipeline built upon industry-leading components such as Prometheus, Telegraf, Grafana and AlertManager — the most powerful combination of monitoring software for cloud-native applications today. DC/OS Monitoring installs with one click from the catalog — and comes with many useful and preconfigured Grafana dashboards.
The business impact of DC/OS Monitoring is clear:
- Greater Operational Visibility
- Increased Infrastructure Efficiency
- Faster Time to Production
One-click Enabling of Integrated Industry Standard Monitoring and Visualization Services
Accessible via the DC/OS Service Catalog, a single click installs the service and begins capturing metrics about your cluster. Then, from the DC/OS UI access pre-configured Grafana dashboards to generate and view reports about the health and performance of your workloads. CNCF standardized components such as Prometheus and Grafana are core to the DC/OS Monitoring service to ensure that you're leveraging the strength of the cloud-native observability community.
Integrated Best Practices for Monitoring and Alerting of Cluster Components and Applications
DC/OS Monitoring ships with the ability to use pre-configured Mesosphere DC/OS dashboards and alerts, as well as those contributed by the community. A pair of public GitHub repositories allow for DC/OS clusters to dynamically update the types of dashboards and alerts you use, as well as provide a place for contributions back to the community. While the dashboards are included in the DC/OS Monitoring package, they're frequently updated and thus you can leverage the dynamic abilities of DC/OS Monitoring to quickly update to the latest dashboards and alert rules, straight from our public GitHub repos:
Automatic Discovery of Cluster Components and Workloads
As soon as DC/OS Monitoring is deployed, it automatically begins discovering the cluster nodes and sub-components enabling you to immediately measure the health and capacity of your cluster. Your own custom applications can also easily export their own metrics via telegraf to DC/OS Monitoring. Thereby encouraging you to build dashboards that include both infrastructure and application utilization for quick troubleshooting and event correlation.
Comprehensive Metrics Aggregation Forwarding to a 3rd Party Solution
Customers who have an existing metrics monitoring and reporting solution in place can integrate DC/OS Monitoring via telegraf to leverage existing investments. For example, transmitting your metrics to Datadog is as simple as configuring a single file.
Getting Started
To get started with DC/OS Monitoring, read our documentation here.
To see the full release notes, visit: https://docs.mesosphere.com/services/dcos-monitoring/1.0.0/release-notes/
Special thanks to Ernest de Leon and Seth Mason